Modified Hata Model
Hata’s formula is restricted to a frequency range of 100
to 1500 MHz, distances between 1-20 km and base station effective heights
between 30 -200m. Modifications were made to improve accuracy relative to the Okumura
curves [1]. Frequency range up to 3000 MHz, and study distance up to 100km are
increased by modifications.
The parameters and restrictions of the Modified Hata used in this part and restriction of the models are shown in table 1
|
Parameter |
Definition |
Range of validity |
|
Lmh |
Modified
Hata propagation. Median dB |
- |
|
hb |
Base
antenna Height, m |
30-300 |
|
hm |
Mobile
Antenna Height, m |
1-10 |
|
U |
0
= small/medium, 1= large city |
0 or 1 |
|
Ur |
0
= open area, 0.5 =suburban, 1= urban |
0-1 |
|
Bl |
Percentage
of Buildings |
3-50 |
|
R |
Range,
km |
1-100 |
|
f |
Frequency,
MHz |
100-3000 |
Table .1 Parameters and Restrictions
of the Modified Hata Model
The other parameters will be
used in Modified Hata’s calculations:
Lccir= Lp
formula (1) in Hata’s Model
am(Hm)=
formula (2) in Hata’s Model
a2(Hm)=
formula (3) in Hata’s Model
a4(Hm)=
formula (4) in Hata’s Model
Lps= formula (5)
in Hata’s Model
Lpo= formula (6)
in Hata’s Model
To validate Hata’s model in
higher frequencies, transition values are defined in the model as follow:
![]()
![]()
Correction for the earth’s curvature, but propagation not beyond
the horizon is written as
The suburban/urban
correction is represented by Ur urbanization parameter as follow:
So=(1-Ur)[(1-2Ur)
Lpo+4UrLps]
Overall height correction ax
is derived combining height corrections used in Hata’s Model with frequency
transition functions and a small / large city parameters,
ax=(1-U)am(hm)+U[a2(hm)F1+a4(hm)F2]
Another term for
contribution of percentage of buildings on loss is considered as
B0=25log(B1)-30
By adding all results ,
modified Hata formula is written as follow:
L=-(Lccir+S0+ax+Sks+B0)
To give an idea about how
modification correlates with Okumura’s measurements, comparison of the Modified
Hata model with Okumura is shown in figure 1
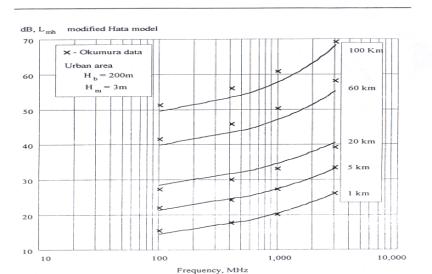
Figure 1 [1]. Comparison of
Modified Hata with Okumura curves
In the figure, it is seen
that Modified Hata model have about 3 dB deviations from the Okumura curves
over the frequency range 100 to 3000 MHz and distance 1-100 km.
The Wireless Simulator
Program output as seen in Figure 2 could verify this deviation by taking Hata’s
approach for Okumura’s curves.
Figure 2 Comparison of Hata with Modified Hata
Study Parameters:
Frequency: 900 MHz,
TX Height (hb)=200m
Mobile Height (hm)=3m
TX Gain: 13 dBi
City Size: Small/Medium
Area Type: Urban
Terrain Parameters:
Average Width: 73.8 m
Average Building Height: 15.84m
Percentage of Buildings: 37%
As shown in output of the
Wireless Simulator Program in the figure, there is about 4dB difference between
Modified Hata and Hata results. This is not expected result when compared with
figure 1. Reason for difference could be use of different building percentage
in both studies and Hata’s small deviation from Okumura’s result. Although
there are ripple difference between Modified Hata and Okumura’s curves, by the
sight of computation, it is worth to use Modified Hata’s Formulas as
representation of Okumura’s measurements since it represents the curves in wide
range.
[1] Sounders, Simon.R., “ Antennas and Propagation for Wireless Communication Systems”,Wiley,New York,1999