Lee’s Model
The approach of this model [1] in prediction
of the received signal is different from others’ approaches. In this model,
dimensions of building blocks get more important. Since the ground incident angles
of the reflected waves are, in general, small due to the low antenna heights
used in micro cells, the exact height of the buildings in the middle of the
propagation path is not important [1].
Received signal is calculated as the subtraction of attenuation due to
buildings from line of sight case. It is formulated as follow:
Pos(non-los) = Plos-aB(B)
where aB is attenuation due to
buildings and has B blockage length.
Model is measurement based
model and attenuation value based on measurements.
Calculation of aB from measurements value as
follow:
i. Calculate the total
blockage length B by adding the individual building blocks as shown in figure 1.
B=a+b+c
ii. Measure the signal
strength Plos
iii. Measure the signal strength Pos
iv. local means value at
point A is Pos(A) , distance from the base station to mobile is d=dA,
then attenuation is defined as
aB( B=a+b+c) = Plos(dA)-Pos(dA)
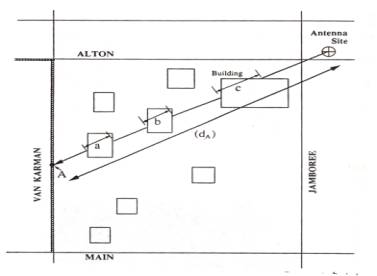
Figure 1 [1]. Building
Block Occupancy at location A
By depending on
measurements, following formulas are derived for received power for los case
and attenuation values aB.
100£d<200 200£d<1000 1000£d<5000
And
B
< 1 1£B< 25 25£B<600 600£B<3000 3000£B
aB = 0
=
1+0.5log(B/10)
=1.2+12.5log(B/25)
=17.95 + 3log(B/600)
=20 dB
where, Pt is the ERP in dBm, d is
the total distance in feet, hb is base station height in feet, B is
the length of blocking in feet.
In order
take effect of hilly terrain into account, antenna height gain term is defined
and overall formula becomes
Pr=Pt-aB ,
Comparison of the model with measurements carried
out in different cities is given in following figures.
Moreover, in [2] comparison of the model with
measurements for different routes, which are zigzag, Los, staircase, and
random, are given. Following figures proves how model give accurate results.
Figure 4[2],
Comparison of the Lee model with measurements for zigzag case
Figure 5[2], Comparison of the Lee model with measurements for Los case
Figure 6[36], Comparison of the Lee model with measurements for Stair case
[1] Lee William C.Y., “ Mobile Communications Design Fundamentals”, Wiley, New York,1993.
[2] W.C.Y.Lee, D.J.Y.Lee, “Microcell Prediction in Dense Urban Area”, IEEE Trans. Veh. Techno. Vol.47, No.1,1998,pp.246-253